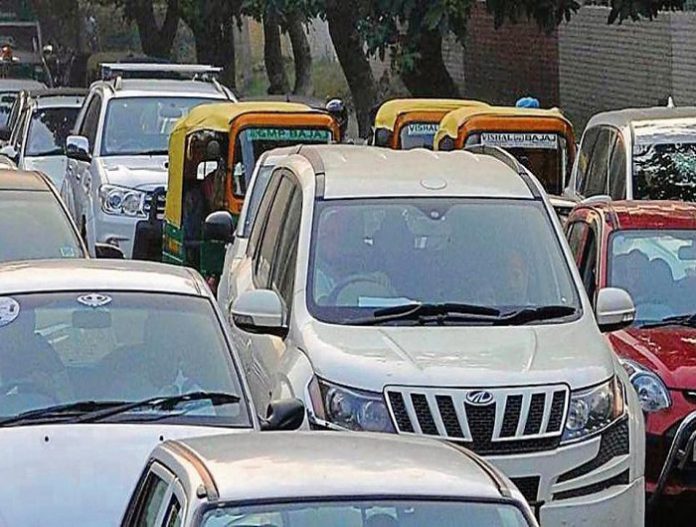
The air quality in Chandigarh was quite poor this year, all thanks to the high vehicle density in the UT. During Diwali, there was a thick smog cover which had engulfed the entire city and had persisted on for about a fortnight. In fact, the government agencies and the people were appalled by the present condition of city beautiful
Here’s What the State of Environment Report (SoER)-2016 Says
Chandigarh has 10,50,299 registered vehicles in total. It has the highest per capita ownership of motorized vehicles in the country. The vehicle density is as high as 878 per 1,000. This is one of the reasons why the air quality in Chandigarh is so deplorable.
The Breakup of the Vehicle Possession
- 3,58,000+ passenger four-wheelers,
- 4,494 buses,
- 10,937 goods vehicles,
- 219 tractors and
- 6,68,000 two-wheelers.
In 2014, the number of vehicles in the UT was 9,88,593. Till December 2015, there was an increase of 61,706 vehicles, as the numbers surged beyond 10.5 Lakhs.
|
State of Pollution in City Beautiful |
||
|
Pollutant Type |
Pollution Level(in µg/m3) |
Permissible Limit(in µg/m3) |
|
RSPM |
94.7 |
60 |
|
SO2 |
Below Detectable Limits |
50 |
|
NO2 |
22.9 |
40 |
6 Main Reasons Responsible for Increasing RSPM
- Burning stubble in harvest season,
- Effect of pollens because of lush greenery in Chandigarh,
- Effect of temperature,
- City location and industries around the city,
- Population, vehicle density and excessive transport load. Rampant use of diesel vehicles for transport degrades the environment as well.
The Silver Lining – Additional Statistics for City Beautiful
Chandigarh has a well-planned waste management structure. 97% of 370 tonnes of municipal waste generated daily is disposed efficiently.
Chandigarh has the second highest average availability of water levels in the country at 332 litre per capita per day (LPCD).
Peak power requirement is 323 MW. 51% is received from Mohali (PSEB), 9% from Dhulkote (BBMB) and remaining 40% from Nalagarh, Himachal Pradesh.
The approved master-plan for generating solar energy is also appreciable. Green cover and forest cover have also increased commendably. The fauna is also thriving despite the drop in tree cover.
(News Source – The Indian Express)
(Image Source – Google Images)
Also Read: Chandigarh Beats Delhi in Pollution Levels. PM 2.5 Three Times Permissible Limit


